Deadweight Loss in Belgium
Below is a structured, concrete analysis of Deadweight Loss in Belgium, presented in English, with sector-by-sector estimates, conceptual graphs, and clear economic mechanisms. The figures are order-of-magnitude estimates, not exact measurements, which is standard for deadweight loss analysis.

Deadweight Loss in Belgium — Sectoral Analysis


1. Labor Market (Largest Source)
Mechanism
Very high tax wedge on labor (income tax + social contributions).
Large gap between employer cost and net take-home pay.
Reduces:
labor supply (hours worked, participation),
labor demand (job creation),
formal employment (pushes activity into grey economy).
Indicative magnitude
Belgium tax wedge ≈ 52–55% (among highest in OECD).
Empirical literature suggests deadweight loss ≈ 20–30% of tax revenue on labor.
Estimated annual deadweight loss
Labor tax revenue ≈ €150–170 bn
Deadweight loss: €30–45 bn/year
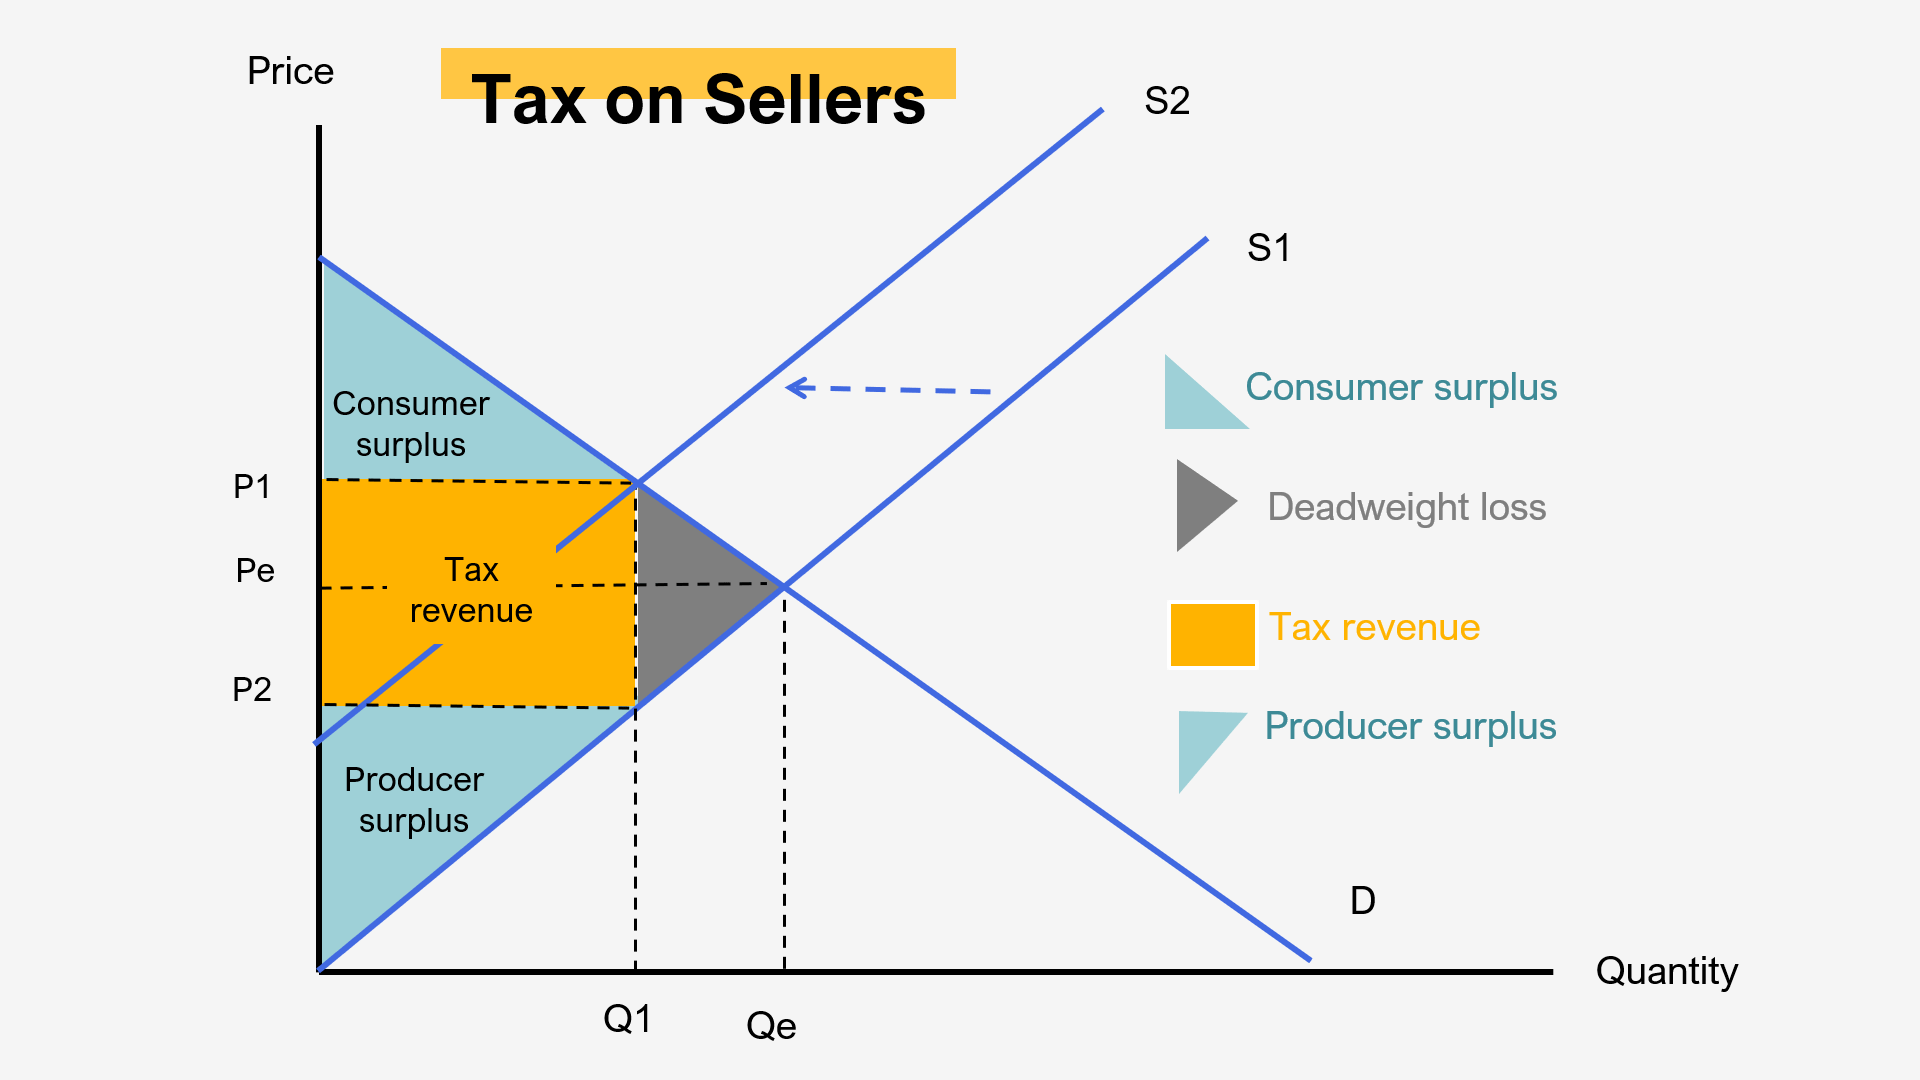
Graph (conceptual)
Standard supply–demand for labor.
Tax shifts wedge → quantity of labor falls.
Triangle between old and new equilibrium = deadweight loss.
2. Housing & Rental Market
Mechanism
Rent regulation, slow permitting, zoning restrictions.
Supply reacts weakly to demand.
Result:
fewer rental units,
higher prices,
misallocation (people stay in suboptimal housing).
Estimated annual deadweight loss
Based on EU housing efficiency studies: 0.3–0.7% of GDP
Belgium GDP ≈ €600 bn
Deadweight loss: €2–4 bn/year
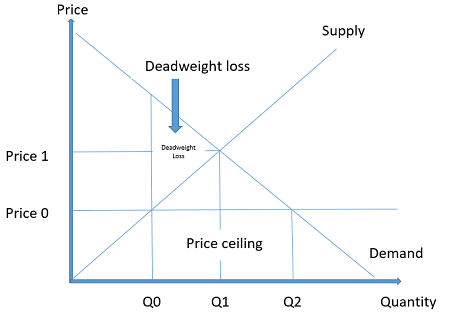
Graph
Supply curve artificially inelastic.
Price ceiling or planning constraint creates shortage.
Lost transactions = deadweight loss.
3. Business Regulation & Administrative Burden (SMEs)
Mechanism
High compliance costs (VAT complexity, payroll rules, reporting).
Entry barriers for SMEs and startups.
Fewer firms enter → less competition → lower output.
Estimated annual deadweight loss
Conservative OECD-style estimate: 0.5–1.0% of GDP
€3–6 bn/year
Graph
Regulation shifts supply curve upward.
Higher prices, lower quantity.
Triangle of unrealized trades.
4. Capital & Entrepreneurship (Risk and Returns)
Mechanism
High effective taxation on:
dividends,
capital gains (direct and indirect),
self-employment income.
Discourages:
scaling businesses,
reinvestment,
risk-taking.
Estimated annual deadweight loss
Typically 0.3–0.6% of GDP
€2–4 bn/year
5. Informal / Shadow Economy (Symptom-Based Loss)
Mechanism
Activity moves outside formal system due to:
taxes,
regulation,
rigidity.
Even if activity exists, efficiency is lower:
no scale,
no financing,
legal risk.
Estimated annual deadweight loss
Shadow economy ≈ 15% of GDP
Efficiency loss estimated at ~20–25%
€15–20 bn/year
(Note: not all shadow activity is deadweight loss; this reflects efficiency loss, not total volume.)
Summary Table (Annual Estimates)
| Sector | Estimated Deadweight Loss |
|---|---|
| Labor market | €30–45 bn |
| Housing & rental | €2–4 bn |
| Business regulation | €3–6 bn |
| Capital & entrepreneurship | €2–4 bn |
| Informal economy inefficiency | €15–20 bn |
| Total (order of magnitude) | €50–75 bn/year |
➡ Roughly 8–12% of Belgian GDP in lost economic efficiency.
Important Clarifications
Deadweight loss ≠ government spending
Taxes transferred to the state are not deadweight loss.
Only destroyed surplus counts.
These losses are structural, not cyclical.
Even small tax or regulatory changes can reduce deadweight loss non-linearly.
Strategic Interpretation
From a policy or business perspective:
Belgium trades equity and stability for efficiency.
The system is resilient but not optimal at the margin.
Marginal reforms (lower labor taxes at the bottom, simpler SME rules) yield disproportionately large gains.
One-Sentence Executive Summary
Belgium likely incurs €50–75 billion per year in deadweight loss, primarily from labor taxation and regulatory rigidity—value that is neither earned by workers, firms, nor the state, but simply never created.
Policy reform scenarios
1) Revenue-neutral “Tax Shift”: Labour → Less Distortive Bases
Policy package
Cut employee SSC / PIT for low–middle earners (“make work pay”).
Finance it via a mix of:
base broadening (remove inefficient tax expenditures),
better capital income taxation / closing gaps (as designed),
stronger pricing of environmentally harmful activities,
optionally more recurrent immovable property taxation (with equity safeguards). (OECD)
DWL channel
Reducing the labour tax wedge increases labour supply/participation and formal employment—Belgium remains among the highest in the OECD. (OECD)
Indicative impact (order of magnitude)
Target: -2 to -5 percentage points in the average tax wedge over 3–5 years.
DWL reduction: typically medium-to-large, because labour taxes are among the most distortionary.
Simple schematic
Employer cost (w+c)   ↑
                      |   S (after tax)
                      |  /
                      | /     DWL triangle shrinks
                      |/___
                      +----------→ Employment
                          D (net wage)
2) Activation & Benefit-Taper Reform (“Remove Participation Traps”)
Policy package
Smooth benefit withdrawal rates (avoid sharp cliffs).
Expand/retarget in-work benefits (“work bonus”) and simplify eligibility.
Tighten pathways that keep people out of the labour force while protecting those with genuine limitations. (OECD)
DWL channel
When the effective marginal tax rate (taxes + lost benefits) is too high, people rationally avoid additional hours or formal jobs → lost mutually beneficial employment matches.
Indicative impact
High potential in Belgium because labour participation/incentives are a recurring concern in OECD/IMF assessments. (OECD)
3) SME/Startup Simplification “One-Stop Compliance” (Regulatory DWL)
Policy package
Reduce administrative load by:
standardised reporting,
single digital interface for payroll/VAT/social declarations,
fewer “micro-rules” and exceptions (base broadening + simplification). (OECD)
DWL channel
Complex compliance increases fixed costs → fewer firm entries, less competition, lower output.
Indicative impact
Medium, but politically feasible because it can be framed as “simplify without cutting protections”.
4) Housing Supply Reform: Permits, Zoning, and Build-to-Rent
Belgium’s housing affordability issues have a strong supply-side component in urban areas; slow/complex permits are a documented barrier in Brussels, and EU-level analysis stresses that supply reforms are essential (demand subsidies alone often inflate prices). (OECD)
Policy package
Shorten and standardise permit timelines (“silence = approval” for specific categories).
Densification around transit; reduce unnecessary procedural steps.
Stable framework for build-to-rent and renovation, with targeted social housing where needed.
DWL channel
Artificially constrained supply → fewer transactions than efficient equilibrium, misallocation (people living in the “wrong” place/size), and productivity losses from commuting/friction.
Indicative impact
Medium-to-high over time (slow burn, but large cumulative effects).
Schematic
Price ↑     Supply constrained (steeper)
      |    /
      |   /
      |  /    shortage / lost trades (DWL)
      |_/__________→ Quantity
        Demand
5) Pension / Effective Retirement Age Reform (Labour Supply at the Top End)
The IMF and other institutions have emphasised raising the effective retirement age and adjusting eligibility regimes to support labour supply and fiscal sustainability. (IMF)
Policy package
Incentivise longer careers (bonuses) and reduce early-exit distortions.
Harmonise special regimes where feasible, protecting genuinely strenuous occupations.
DWL channel
Early exit can create labour shortages and reduces output—particularly costly in ageing economies.
Indicative impact
Medium, with strong long-run benefits.
6) Shadow Economy Reduction: Make Formalisation Easier (Not Just Enforcement)
Belgium has policy frictions around payments and informality; while not all informality is “pure DWL,” lower informality generally improves allocation, competition, and tax neutrality. (law.kuleuven.be)
Policy package
Reduce incentives to go informal (scenario 1 & 3).
Targeted e-invoicing / real-time VAT reporting in high-risk sectors (phased, support for SMEs).
Enforcement where necessary, but paired with simpler compliance.
DWL channel
Less informality → more scale, financing, productivity, and fewer “wasted” avoidance costs.
Indicative impact
Medium, but complementary and reinforcing.
A pragmatic “3-lane” reform program
Lane A (Fast, 6–18 months): highest feasibility
SME simplification
Benefit taper smoothing / activation adjustments
Targeted compliance digitalisation (NBB)
Lane B (Structural, 1–3 years): biggest DWL reduction
Revenue-neutral tax shift away from labour
Pension/retirement incentives (IMF)
Lane C (Long horizon, 2–5 years): housing supply
Permit reform + zoning/densification + build-to-rent (OECD)